💾 In defense of DOMContentLoaded
Part of the value of the vital metrics is that they’re so focused directly on the user experience, that they give a very stable starting point for a top-down approach to understanding how your site performs.
But that doesn’t mean that other metrics, or even what we might consider “legacy” metrics, don’t have value. In fact if you’re hyper-focused on vitals and ignoring the rest, you’re almost certainly missing out on a ton of wildly useful information.
You have your metrics that are your primary goalposts, and then you have metrics that are supporting or diagnostic metrics that help you better understand what’s happening with those goalposts. (AirBnB calls these metrics “meta metrics”).
Harry Roberts gave a great example with DOMContentLoaded—a metric that used to be one of the primary goalposts, but that is now rarely talked about.
Harry was working with a client with a ton of deferred JavaScript and wanted to better understand when all that JavaScript was finished loading, so he whipped up a few recipes around DOMContentLoaded and friends to determine when that JS was done executing, and how long that execution took.
That data also helped him identify that “…tracking and improving DOMContentLoaded will have a direct correlation to an improved customer experience.”
It’s a good reminder that there’s more to performance than Core Web Vitals.
💰 Calculating the cost of internet shutdowns
Awhile back I mentioned David Belson’s excellent post on countries shutting down the internet to prevent cheating during exams, and the massive detrimental impact that can cause.
Now you can quantify it.
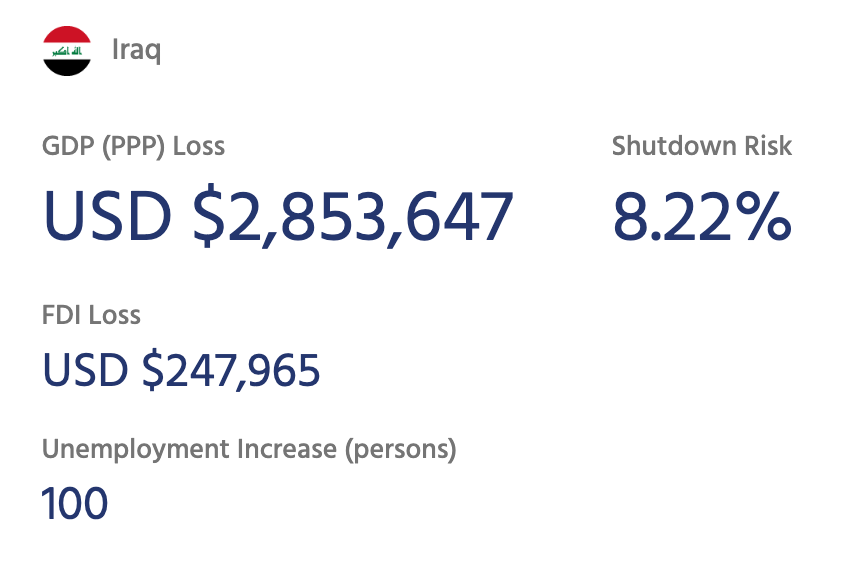
The Internet Society released a NetLoss Calculator that attempts to quantify the cost of a potential shutdown in terms of Gross Domestic Product (GDP), Foreign Direct Investment (FDI) and unemployment increase.
For example, Belson noted Iraq implementing a country-wide internet shutdown during exams. According to the calculator, a one-day shutdown at that time period equates to roughly a $2.8 million USD loss in GDP, and an unemployment increase of 100 persons.

Pretty massive impact.
🔦 INP in the Search Console report
As Google works on slowly replacing First Input Delay with Interaction to Next Paint, they’ve now started reporting on INP issues in the search console to build that awareness and let folks get ahead of the problem before March’s swap comes around.

I’d say it’s working. I’ve gotten several emails in the past two weeks from folks who are suddenly finding themselves getting emails about INP issues.
I’m happy to see the focus on building awareness early. I mentioned it before, but I really think that INP is going to be one of the more challenging vitals to optimize, and it has a demonstrable impact on business metrics and user experience—no time like today to start optimizing it.
📏 Measuring Session Replay Overhead
I don’t think it’s any secret that third-party resources can be a massive performance issue. Convincing vendors to fix them can be challenging though.
A lot of times, the initial reaction from vendors can be "it’s not our script". And in their defense, that’s because a lot of times they’re not given much beyond anecdotal evidence to make a case that they are causing problems.
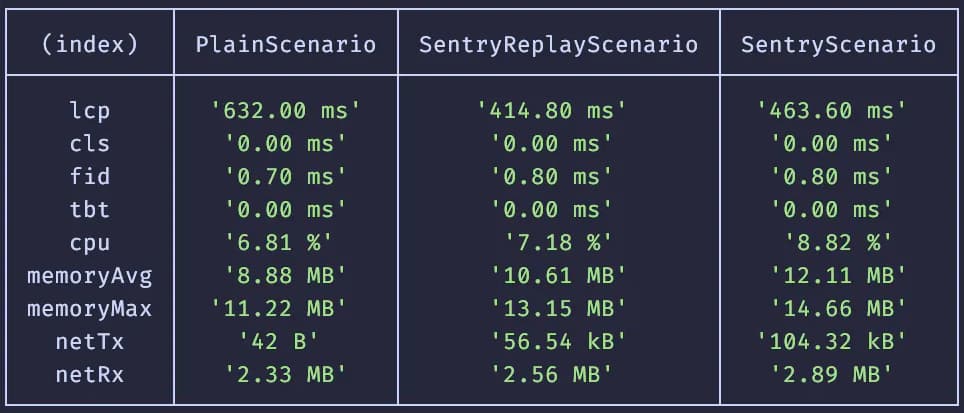
So I really like that Sentry is taking the time not just to benchmark their session replay tool, but to provide an open-source tool that others can use to benchmark overhead as well. I also really like that one of the default metrics the tool reports on is memory impact—it’s a big issue that doesn’t get enough attention due to lack of intuitive tooling and prominent, easy-to-collect metrics.

Jacob Groß suggested they also report on interaction times to see potential impact on INP, which feels like a solid way to improve an already helpful tool.