🧳 Building PerfWork
I’m building perfwork—a job board for web performance enthusiasts. If you’re interested, you can sign up and I’ll let you know when it’s ready.
I tend to get a fair share of companies reaching out who have performance-related roles they want to fill. I also tend to get a fair share of folks reaching out asking if I know of companies with open roles that involve working on performance. There’s not really anywhere to send either of them today, so I figured I could build something that would fix that.
It also just seemed like the right time. There’s a lot of talent out there, and a lot of companies who need the help—there’s just a disconnect that makes it harder than it should be to match them.
The early interest seems to support the need. I haven’t done anything to promote it other than posting a short announcement on the usual social media suspects (on a Friday afternoon because I’m a great marketer like that), and there are already 300+ folks who have reached out (including a very encouraging and healthy amount of employers).
I’ll be honest: I had a fairly straightforward idea of what this would look like, but the interest has been significant so I’m going to take a moment to reach out to some of the folks on that early list to get some feedback and make sure I’m on the right path.
If you’re keen to talk more about what you’re hoping this will accomplish for you (whether as someone looking, or someone posting), definitely reply and let me know—I’d love to chat!
Get a heads up when it’s ready
🧐 Debugging Interaction to Next Paint
Anyone who has talked to me at all in the last few years knows by now that I cannot wait for First Input Delay to go the way of the do-do bird. (My personal nickname for it is FID the Fibber.) It’s a metric that tends to mask the real issues and gives folks a false sense of “hey, we’re nailing this interactivity stuff”.
I’m optimistic that Interaction to Next Paint is going to be a big step forward there. Quite honestly, I think the combination of INP, the Event Timing API it’s built on top of, and Chrome’s experiments with soft-nav heuristics are about to bring a bit of a reckoning to the web and highlight just how much negative impact on performance and user experience the way we’ve been building the past 10 years or so has had.
Annie Sullivan recorded a super approachable video showing how to use the Chrome DevTools Performance Panel (which can be intimidating in its own right) to debug interaction performance issues. She’s got some handy tips for how to navigate the panel, how to spot interaction issues, and how to determine the root cause.
Early hints and TTFB
I was just talking to someone yesterday about the challenges they’re having at their company around standardizing on how metrics are defined and reported. It’s a frequent problem I see—companies who have multiple sources of performance data struggle to explain why a particular metric reported in one doesn’t match another. And it’s not just comparing RUM to synthetic data—even in the same category, tools sometimes measure in different ways and those little minor inconsistencies add up to a whole lot of confusion and mistrust.
It’s bad enough when the tools don’t quite align, but it’s worse when the metric itself can vary based on the technology used.
That’s the situation we find ourselves in at the moment with Early Hints and Time to First Byte. Early Hints is a new experimental standard that enable servers to send a response (using the new 103 code) with “hints” about what domains the browser should preconnect to, or even what resources it should preload. That way the browser can get started on those while the server is still responding with it’s full response.
The image below, posted by Tim Vereecke, shows the potential very well.
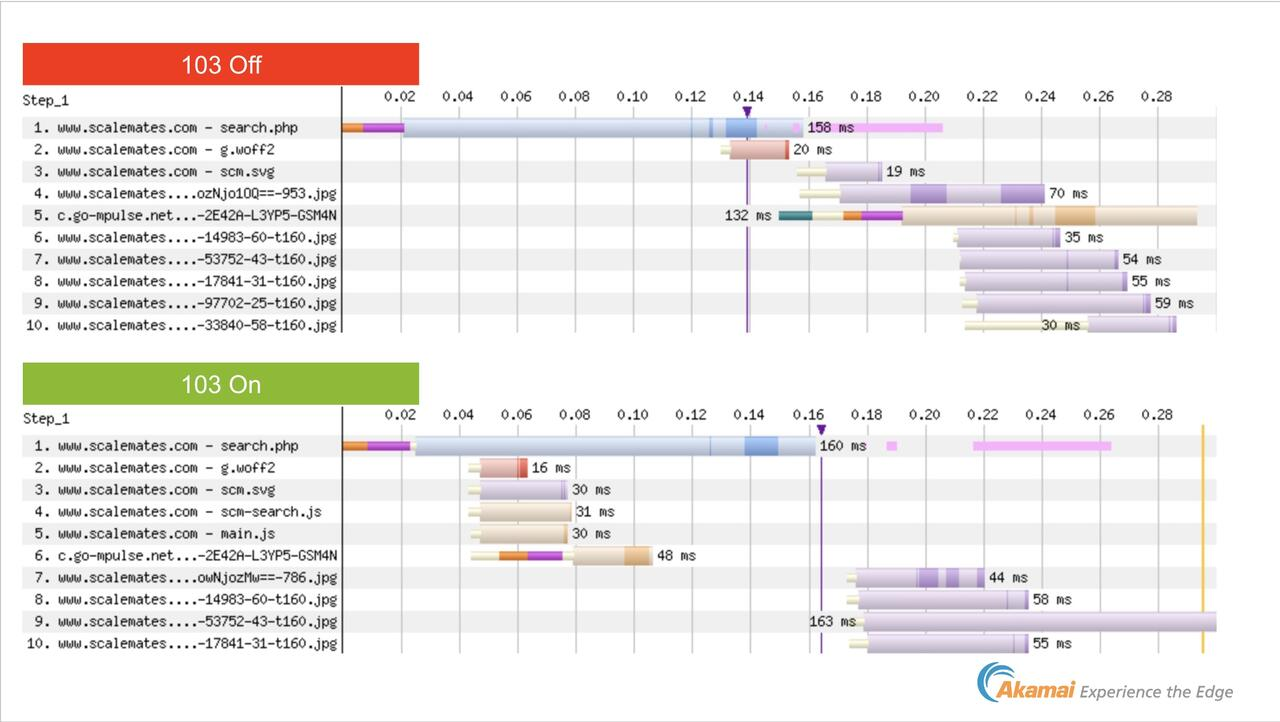
Unfortunately, the approach does change the way Time to First Byte is measured. When TTFB is measured and early hints are used, it now reports when that first 103 response occurs, not when the actual response of your HTML occurs—fundamentally changing what the metric is reporting.
There’s a suggested change to the Resource Timing API to address this. It introduces a new firstInterimResponseStart timing and ensures that responseStart, can be consistent for TTFB regardless of if early hints are used or not. It’s already in Chrome behind a flag, and it sounds like as long as there isn’t push back, it should be on by default as early as Chrome version 115.
✂️ Reducing Variable Font Weight
Stefan Judis always does a great job of posting about what he’s learning at the moment, and I’ve been enjoying his recent posts around optimizing fonts.
It started with him playing around with variable fonts to see how he could use the grade axis (GRAD in CSS—don’t get me started on the bizarre abbreviations for variable font axes) to avoid layout shifts when fonts are made bolder. Clever stuff, but he soon bumped into one big issue with variable fonts: they’re kinda huge. (The example he’s using, Roboto, comes in at 700kb!)
That lead him down a journey to try to reduce the size of the font, first with subsetting, then with removing font axes. He mentions a few of my favorite font tools in the process—Glyphhanger and the massively under-appreciated and wonderfully named Wakamai Fondue—but he also introduced me to Slice, tool you can use to limit font axis ranges to reduce your font size even more. I wasn’t familiar with that tool before, but I’m eager to start playing with it.
Take care,
Tim