🏎️ Faster code view on GitHub
There was a super interesting post the other day from GitHub about improving the performance of their code view, and doing so without comprising user experience and accessibility. I love how clearly they stated the guiding principles for this page so you can see what they needed to improve, but also the things they were unwilling to compromise on.
A lot of the issues came down to DOM complexity and React’s challenges with that—they mention a CODEOWNERS file that is 18,000 lines long resulting in “…React’s first pass at building the DOM for this page takes nearly 27 seconds.”
They do a wonderful walk through of not just the final conclusion, but also the things they tried along the way that didn’t work out.
In the end, they had to side-step React to get the performance boost they were after:
With React managing the entire DOM, we hit the “end” key to move all the way to the end of the file, and it takes the browser 870 milliseconds to finish handling the “keyup” event, followed by 3,700 milliseconds of JavaScript blocking the main thread. When we generate the code lines as HTML strings, handling the “keyup” event takes only 80 milliseconds, followed by about 700 milliseconds of blocking JavaScript.
It seems, to me, a good reminder that the more abstraction we place in front of the browser itself, the more problems we create. Sometimes it may still make sense to use abstractions, but it’s a trade-off that we see over and over again and one that we should consider with caution before making.
🏞️ The decoding attribute decoded
The decoding attribute has been around in browsers since 2018. It has broad browser support—Chrome, Edge, Safari and Firefox have all supported it for several years. It’s also perhaps one of the least understood attributes out there.
Barry Pollard wrote a post breaking down exactly what the decoding attribute actually does, and it’s the best explanation I’ve seen of the attribute to date. There’s a good explanation, some demos courtesy of Jake Archibald, and a cross-browser focus (which I always appreciate—performance conversations are all too frequently Chrome-centric nowadays).
His conclusion is kind of the same as mine. Barry notes that “So, yes this attribute might help, but in many cases it won’t help noticeably (if at all).”
That’s been my take. I can’t think of a single time I’ve tried to use the attribute in the 5 years of its existence that I was able to see any real-world performance improvements. And I also don’t think I’ve ever read a real-world case study about it’s use having an impact either. (If you’ve got one, please send it my way!)
This one is probably best viewed as an edge case kind of thing that you almost certainly don’t need to worry about in your day-to-day work.
🎥 INP, SPA and other acronyms
I love a good meetup, particularly a good performance meetup. Community events like meetups and WebPerfDays (may it RIP, though it sounds like something similar might happen around perf.now() this year) were a huge part of how I first got involved in the performance community, so I’ll always have a soft-spot for them.
So it’s really nice to see a few starting to pop back up. After a 5-year absence, the Hamburg Web Performance Group had their second meetup of the year last week. Even better, the group has been posting videos of each talk on YouTube for all to enjoy.
There was a really approachable talk from Brian Louis-Ramirez about Debugging INP (a hot topic to be sure). In a recent AMA hosted by Henri and featuring Michal Mocny, Barry Pollard and Annie Sullivan, they mention that LCP is still the vital that they see the lowest pass rate for, but I think I agree with Brian’s assessment that INP is going to be the most challenging metric to improve (at least for sites that struggle with it). INP issues most typically result from the heavy-JS architectures we see out there today, and the path to improving it is going to be much steeper.
My personal belief is that more sites pass the INP threshold because the threshold itself is pretty darn forgiving (in the AMA, Michal also mentions that he feels the threshold is pretty generous). 200ms is far from a blazing fast interaction, and in reality you should really be trying to get that closer to 100ms if we’re talking about putting the focus on a solid user experience.
Speaking of heavy-JS architectures, the other talk at the meetup discussed measuring the performance of single-page applications. At the end, Erik Witt mentioned they ran an AB test comparing the same Vue.js app using traditional navigation versus the single-page application model, measuring using the experimental Chrome flag, and they saw that soft navigations were slower.
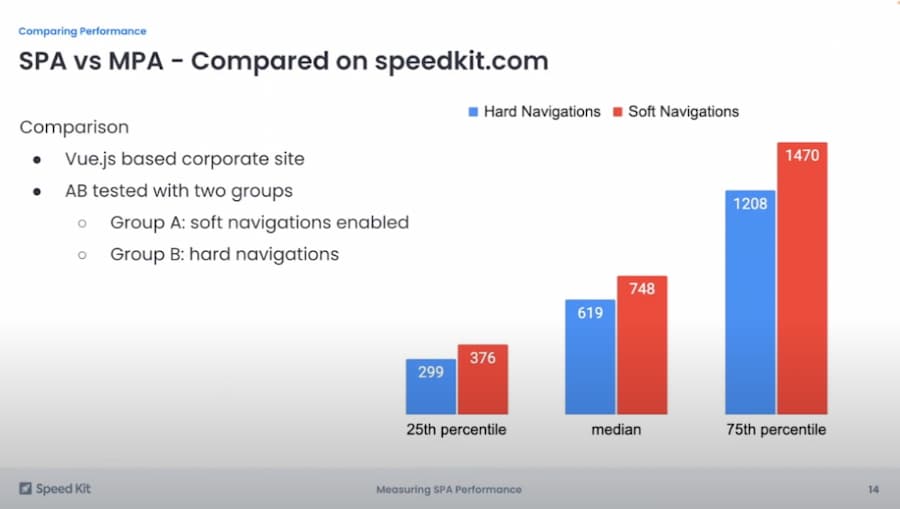
This…actually doesn’t surprise me a bunch.
I’m really interested to see more folks do this sort of comparison once SPA soft-navigation measurements become easier. There’s going to be a lot of variability because the performance of those soft-navigations is highly dependent on the performance of the framework you’re using and how efficiently your development team made the app in the first place.